Abnormal reactivity of the ∼20-hz motor cortex rhythm in unverricht lundborg type progressive myoclonus epilepsy
NeuroImage 12, 707–712 (2000) doi:10.1006/nimg.2000.0660, available online at http://www.idealibrary.com on
Abnormal Reactivity of the ϳ20-Hz Motor Cortex Rhythm in Unverricht
Lundborg Type Progressive Myoclonus Epilepsy
Teija Sile´n,* Nina Forss,* Ole Jensen,* and Riitta Hari*,†
*Brain Research Unit, Low Temperature Laboratory, Helsinki University of Technology, P.O. Box 2200, FIN-02015 HUT, Espoo, Finland;and †Department of Clinical Neurophysiology, Helsinki University Central Hospital, FIN-00290 Helsinki, Finland
rebound within 1 s (Salmelin and Hari, 1994; Salenius
The ϳ20-Hz component of the human mu rhythm et al., 1997). The rebound is suppressed by simulta-
originates predominantly in the primary motor cor-
neous finger movements (Salenius et al., 1997; Schnitz-
tex. We monitored with a whole-scalp neuromagne-
ler et al., 1997), motor imagery (Schnitzler et al., 1997),
tometer the reactivity of the ϳ20-Hz rhythm as an
and even by viewing another person making finger
index of the functional state of the primary motor
movements (Hari et al., 1998). The ϳ20-Hz rebound
cortex in seven patients suffering from Unverricht–
has been suggested to reflect inhibition and its sup-
Lundborg type (ULD) progressive myoclonus epi-
pression excitation or disinhibition of the motor cortex
lepsy (PME) and in seven healthy control subjects.
(Salmelin and Hari, 1994). This view is supported by a
In patients, the motor cortex rhythm was on average
recent transcranial magnetic study that showed de-
5 Hz lower in frequency and its strength was double
creased motor cortex excitability following median
compared with controls. To study reactivity of the ϳ
nerve stimulation with a time course corresponding to
20-Hz rhythm, left and right median nerves were
the rebound of the 20 Hz motor cortex rhythm (Chen etstimulated alternately at wrists. In controls, these stimuli elicited a small transient decrease, followed by a strong increase (“rebound”) of the ϳ20-Hz level.
Patients with progressive myoclonus epilepsy (PME)
In contrast, the patients showed no significant re-
of Unverricht–Lundborg type (ULD) suffer from corti-
bounds of the rhythm. As the ϳ20-Hz rebounds ap-
cal myoclonic jerks, tonic-clonic epileptic seizures and
parently reflect increased cortical inhibition, our
ataxia. Their cortical somatosensory responses are
results indicate that peripheral stimuli excite motor
greatly enhanced, “giant,” suggesting pathological hy-
cortex for prolonged periods in patients with ULD.
perexcitability of the somatosensory cortex (Shibasaki
2000 Academic Press
and Kuroiwa, 1975; Chadwick et al., 1977; Karhu et al.,Key Words: magnetoencephalography; inhibition;
1994). On the other hand, transcranial magnetic stim-
sensorimotor cortex; temporal spectral evolution; hu-
ulation studies have suggested hyperexcitability of the
motor cortex in patients with cortical myoclonus(Brown et al., 1996; Valzania et al., 1999).
Our aim in the present study was to monitor possible
INTRODUCTION
changes in the reactivity of the ϳ20-Hz motor cortexrhythm in genetically homogeneous ULD patients to
The human cortical mu rhythm, observed over the
investigate the functional state of their motor cortex.
sensorimotor areas both in electroencephalographic(EEG) and magnetoencephalographic (MEG) record-
MATERIALS AND METHODS
ings, is characterized by dominant frequencies in ϳ10-and ϳ20-Hz bands (for a review, see Hari and Salme-
lin, 1997). The ϳ20-Hz activity seems to originate dom-
patients (ages 18 –35 years, 3 females, 4 males) and 7
inantly in the precentral primary motor cortex, and
healthy control subjects (ages 25–36 years, 4 females, 3
thus can be used as an index of the functional state of
males). The experimental protocol was accepted by the
the motor cortex (Jasper and Penfield, 1949; Salmelin
Ethical Committee of the Department of Clinical Neu-
and Hari, 1994; Hari and Salenius, 1999).
rosciences and an informed consent was obtained from
Mu rhythm level reacts to somatosensory stimula-
each subject before the recording. All patients had ho-
tion. For example, in healthy subjects, median nerve
mozygous expansion mutation in cystatin B gene in
stimuli result in an initial small decrease of the
chromosome 21. Their clinical symptoms were focal
ϳ20-Hz rhythm level, followed by a strong transient and generalized myoclonic jerks, tonic-clonic seizures
All rights of reproduction in any form reserved. Note. Score for myoclonic jerks in daily life: ϩ occasional; ϩϩ frequent; ϩϩϩ very frequent myoclonic jerks. Score for ataxia: ϩ slight; ϩϩ
moderate; ϩϩϩ severe. Score for disability: 1 slight, barely detectable; 2 moderate, can walk without help, clumsiness; 3 severe, needssupport in walking or uses a wheelchair.
and cerebellar symptoms of varying degree. The pa-
were calculated with a frequency resolution of 0.3 Hz),
then rectified, and finally averaged time-locked to the
azepam, piracetam, topiramate, and lamotrigine in
stimuli. The analysis period of 5 s started 2.5 s before
various combinations. The medication was kept un-
changed before and during the measurement. A clinical
The ϳ20-Hz rhythm level was quantified from the
neurologist divided the patients according to the sever-
MEG channel over the contralateral sensorimotor cor-
ity of their motor symptoms. Table 1 summarizes the
changes. The baseline level was determined as the
mean level during the 300-ms period just preceding the
dian nerves (LMN, RMN) were stimulated alternately
stimulus, and the rebound was quantified as the mean
at the wrists once every 1.5 s, resulting in an interval
level during 400 – 800 ms after the stimulus.
of 3 s for each nerve. The intensity of the 0.2-ms stim-
To ascertain that the TSE frequency bands were
ulus was individually adjusted to exceed the motor
optimally chosen for each subject, time-frequency rep-
threshold, and 55–90 stimuli were delivered to each
resentations (Tallon-Baudry et al., 1996) were calcu-
nerve during one experiment. During the measure-
lated from 5 to 35 Hz over the whole analysis period
ment, the subject sat relaxed with the eyes open and
and then averaged time-locked to the stimuli. This
the head supported against the helmet-shaped bottom
approach provides estimates for the energy of the sig-
of the neuromagnetometer. Myoclonic signs were eval-
nal as a function of time and frequency.
uated with continuous videomonitoring and a nurse
Sources of the spontaneous activity were identified
accompanied the patient in the magnetically shielded
in one patient from the bandpass-filtered (4 –12 and
room to monitor and report possible myoclonic jerks;
10 –20 Hz) signals recorded at rest. Equivalent current
only infrequent jerks were observed during the record-
dipoles were searched with a least-squares fit over a
subset of 18 –20 sensors. Dipoles were accepted only if
Cortical magnetic signals were recorded in a mag-
they accounted for at least 85% of the field variance.
netically shielded room with a whole-scalp Neuromag-
About 50 dipoles were accepted for both frequency
122 magnetometer. The signals were bandpass filtered
ranges and their locations were superimposed on mag-
(0.03–190 Hz in controls, 0.03–320 Hz in patients),
netic resonance images, obtained with a 1.5-T Siemens
digitized at 0.6 kHz in controls and at 1 kHz in pa-
Magnetom device of the patient. Statistical signifi-
tients, and stored on an optical disk for off-line analy-
cance was tested by Student’s two-tailed t test.
sis. Head position with respect to the sensor array wasdetermined by measuring magnetic signals from fourindicator coils placed on the scalp. The coil locations
with respect to anatomical landmarks on the headwere identified with a 3-D digitizer.
Figure 1 shows for Control 6 and Patient 5 3-s epochs
of the rhythmic activity during rest from one channel
motor-cortex rhythm were quantified with temporal
over the left sensorimotor cortex. The corresponding
spectral evolution (TSE; Salmelin and Hari, 1994). The
MEG spectra, shown on the right, were calculated from
signals were filtered through 10 –30 Hz (typically
2-min periods. In the control subject, the main fre-
10 –20 Hz in patients and 15–25 Hz in controls, de-
quency peak is observed at 12 Hz, with a minor peak at
pending on peak frequencies in individual spectra that
24 Hz. In the patient, the rhythmic activity is about
MOTOR CORTEX RHYTHM IN MYOCLONUS EPILEPSY
Left: 3-s periods of spontaneous activity from one MEG channel over the left sensorimotor cortex in Control 6 and Patient 5 during
rest. Signals were filtered through 3– 40 Hz. Right: MEG spectra of 2-min epochs from the corresponding channels (not filtered).
two times stronger and peaks at lower frequencies, 7
sponse. In the control subjects, the ϳ20-Hz rhythm is
first suppressed after the evoked response and then
The mean (ϮSEM) peak frequency of the ϳ10-Hz
strongly enhanced; this “rebound” reaches its peak am-
component of the mu rhythm was 2.5–2.7 Hz lower in
plitude at 500 –700 ms. In the two patients, the behav-
patients than in controls (8.1 Ϯ 0.3 Hz vs 10.6 Ϯ 0.5 Hz
ior of the 20-Hz rhythm differs in many respects: (i) the
over the left hemisphere, P Ͻ 0.005; 8.1 Ϯ 0.3 Hz vs
baseline level is much stronger than in the controls, (ii)
10.8 Ϯ 0.4 Hz over the right hemisphere, P Ͻ 0.001).
the suppression is stronger and prolonged, and (iii)
The ϳ10-Hz spectral peak was stronger in patients
there is no rebound. In controls, the rebounds peaked
than in controls (38.9 Ϯ 8.7 fT/cm vs 20.4 Ϯ 5.7 fT/cm
over the left and 46.8 Ϯ 5.2 fT/cm vs 21.9 Ϯ 4.6 fT/cmover the right hemisphere; the difference was statisti-cally significant in the right hemisphere, P Ͻ 0.005).
The ϳ20 Hz rhythm peaked at 4.6 –5.3 Hz lower
frequencies in patients than in controls (15.9 Ϯ 0.8 Hzvs 20.5 Ϯ 1.2 Hz over the left and 16.3 Ϯ 1.0 Hz vs21.6 Ϯ 1.5 Hz over the right hemisphere; P Ͻ 0.01 andP Ͻ 0.05, respectively). The strength of the ϳ20 Hzspectral peak was ϳ2-fold in patients compared withcontrols (21.3 Ϯ 2.9 fT/cm vs 8.7 Ϯ 1.0 fT/cm over theleft hemisphere and 25.6 Ϯ 3.3 fT/cm vs 10.6 Ϯ 1.0fT/cm over the right hemisphere; P Ͻ 0.001 for bothdifferences).
The mean (ϮSEM) source locations of the rhythmic
signals of Patient 5, superimposed on her MR images,agreed with the location of the hand region of thecentral sulcus. The mean location was 4 mm moreanterior (P Ͻ 0.05) for the 10 –20 Hz than for the 4 –12Hz oscillations, in agreement with previously sug-gested generation of the higher mu rhythm componentin the precentral motor cortex.
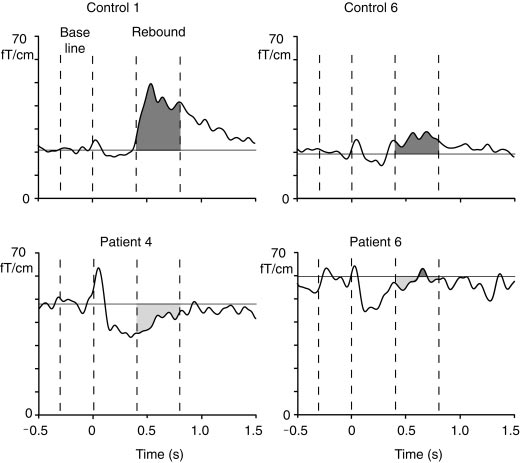
Figure 2 shows reactivity of the ϳ20-Hz level over
the right sensorimotor cortex in Controls 1 and 6 and
Stimulus-related changes in the ϳ20-Hz mu rhythm
in Patients 4 and 6; the left median nerve was stimu-
level of Controls 1 and 6 and Patients 4 and 6. Light gray shadowed
lated at time 0. In all traces, the transient increase
areas show the suppression and dark gray shadowed areas the
immediately after the stimulus reflects the evoked re-
rebounds 400 – 800 ms after stimulus.
Time-frequency representation of the energy at 5–35 Hz from 500 ms before to 1500 ms after LMN stimulation of Control 1 and
Patient 4. Note the logarithmic scale of the energy.
In the patient group, the baselevel of the ϳ20-Hz
baselevel and did not differ statistically significantly
activity was about double compared with that of the
controls: the mean (ϮSEM) amplitudes were 44.2 Ϯ 4
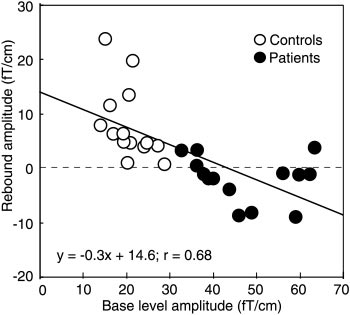
Figure 5 shows rebound strengths of all controls and
fT/cm vs 19.2 Ϯ 2 fT/cm (P Ͻ 0.005) in the left and
patients plotted against the baselevel amplitude of the
50.0 Ϯ 4 fT/cm vs 22.0 Ϯ 1 fT/cm (P Ͻ 0.001) in the
ϳ20-Hz rhythm. Although the rebound strength corre-
right hemisphere for patients and controls, respec-
lated negatively (P Ͻ 0.001) with the baseline level of
the rhythm in the pooled data of both groups, no sig-
Figure 3 shows the time-frequency representation of
nificant correlation was found between these parame-
the 5–35 Hz energy after LMN stimulation for Control
ters when both groups were studied separately. In
1 and Patient 4. In the control subject, the energy is
addition, the strength of the rebound did not correlate
strongly enhanced, representing the rebound of the 15-
either with the amplitude of the P30m deflection of the
to 20-Hz band 500 –700 ms after stimulus, whereas in
somatosensory evoked fields or with the severity of the
the patient the energy decreases for about 1 s after the
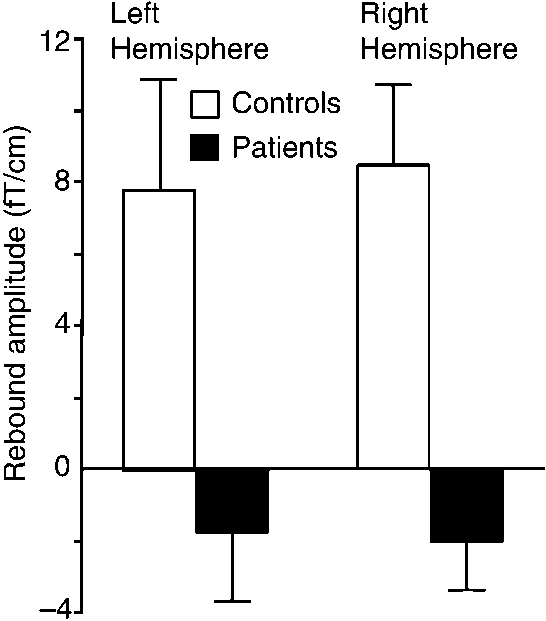
Figure 4 illustrates the mean (ϩSEM) strengths of
DISCUSSION
the rebounds in both subject groups. In controls, therebounds were statistically significant on both left (P Ͻ
The present results revealed clear abnormalities in
0.05) and right (P Ͻ 0.01) hemispheres. In patients, the
the reactivity of the ϳ20-Hz motor-cortex rhythm in
mean amplitudes were negative with respect to the
Strength of rebound to LMN and RMN stimuli (at 400 –
Mean (ϮSEM) amplitude of the ϳ20-Hz motor cortex
800 ms) as a function of the baseline level of the 20 Hz rhythm
(during 300 ms before the stimulus) in all subjects.
MOTOR CORTEX RHYTHM IN MYOCLONUS EPILEPSY
patients with ULD: (i) the peak frequency was about 5
Common to all our patients was mutation in cys-
Hz lower in patients than in controls, (ii) the baseline
tatin B gene. The patients were thus homogeneous
mean amplitude of the ϳ20-Hz activity was double
according to the genotype accounting for their dis-
compared with that of the controls, and (iii) there was
ease. The neurophysiological findings were also
no rebound following median nerve stimuli.
rather homogeneous in the whole patient group de-
Source analysis of the signals in one patient con-
spite the great variability of the severity of the motor
firmed that the higher frequency oscillations of the mu
symptoms. However, within the patient group the
rhythm were mainly generated in the motor cortex, in
rebound amplitude did not correlate with the motor
line with previous studies in healthy subjects (Jasper
disability, suggesting that the changes in the reac-
and Penfield, 1949; Salmelin and Hari, 1994; Hari and
tivity of the motor cortex are connected more closely
Salenius, 1999). Thus the ϳ8- and ϳ16-Hz mu rhythm
to the mutated cystatin B gene rather than to the
components of our ULD patients apparently corre-
clinical expression of the gene mutation.
spond to the ϳ11- and ϳ21-Hz oscillations in healthysubjects. The slowing of the mu rhythm in patients
ACKNOWLEDGMENTS
could be due to degenerative changes in the brain ordue to anticonvulsive polytherapy.
This study was financially supported by the Academy of Finland
The time-frequency representation confirmed that
and the Instrumentarium Science Foundation. We thank Dr. A-E.
the frequency bands for the TSE analysis were chosen
Lehesjoki for DNA analysis of the patients, Dr. S. Avikainen for
correctly and did not miss rebounds at any other fre-
comments on the manuscript, and Ms. M. Illman for skillfull tech-
quencies. Since the rebound of the 20-Hz rhythm is
supposed to reflect inhibition of the motor cortex(Salmelin et al., 1995; Chen et al., 1999), the observed
REFERENCES
lack of the rebound indicates prolonged excitation ofthe motor cortex after somatosensory stimuli, in line
Brown, P., Ridding, M. C., Werhahn, K. J., Rothwell, J. C., and
with previously observed hyperexcitability of the motor
Marsden, C. D. 1996. Abnormalities of the balance between inhi-
cortex in patients with cortical myoclonus (Brown et
bition and excitation in the motor cortex of patients with cortical
al., 1996; Valzania et al., 1999).
myoclonus. Brain 119: 309 –317.
Mechanisms underlying the higher baseline level of
Chadwick, D., Hallett, M., Harris, R., Jenner, P., Reynolds, E. H.,
and Marsden, C. D. 1977. Clinical, biochemical, and physiological
the motor cortex rhythm could be searched for from
features distinguishing myoclonus responsive to 5-hydroxytrypto-
animal models. In monkeys, application of GABA an-
phan, tryptophan with a monoamine oxidase inhibitor, and clon-
tagonist to the primary motor cortex enhanced both
azepam. Brain 100: 455– 487.
movement-related and spontaneous neuronal activity
Chen, R., Corwell, B., and Hallett, M. 1999. Modulation of motor
and increased the number of active neurons; the neu-
cortex excitability by median nerve and digit stimulation. Exp. Brain. Res. 129: 77– 86.
ronal changes were accompanied by clumsy move-
Haltia, M., Kristensson, K., and Sourander, P. 1969. Neuropatholog-
ments and muscle jerks that became so frequent that
ical studies in three Scandinavian cases of progressive myoclonus
they had to be terminated with barbiturate to prevent
epilepsy. Acta Neurol. Scand. 45: 63–77.
generalized seizures (Matsumura et al., 1991, 1992).
Hari, R., and Salmelin, R. 1997. Human cortical oscillations: A view
These disturbances closely resemble the clinical symp-
through the skull. Trends Neurosci. 20: 44 – 49.
toms of our ULD patients. Furthermore, the observed
Hari, R., Forss, N., Avikainen, S., Kirveskari, E., Salenius, S., and
high baseline level of ϳ20-Hz rhythm could reflect
Rizzolatti, G. 1998. Activation of human primary motor cortexduring action observation: A neuromagnetic study. Proc. Natl.
either a larger number of active neurons or their
Acad. Sci. USA 95: 15061–15065.
higher synchrony. Thus our findings may reflect de-
Hari, R., and Salenius, S. 1999. Rhythmical corticomotor communi-
creased GABA-ergic inhibition in the motor cortex of
cation. Neuroreport 10: R1–10.
Jasper, H., and Penfield, W. 1949. Zur Deutung des normalen Elek-
Although thalamocortical and intracortical connec-
troencephalogramms und seiner Vera¨nderungen. Arch. Psych.
tions are known to play an important role in the gen-
Zeitschr. Neurol. 183: 163–174.
eration of cortical rhythms (Lopes da Silva et al., 1980),
Karhu, J., Hari, R., Paetau, R., Kajola, M., and Mervaala, E. 1994.
Cortical reactivity in progressive myoclonus epilepsy. Electroen-
the cerebello–thalamo– cortical loop may also have an
ceph. Clin. Neurophysiol. 90: 93–102.
effect on the motor-cortex rhythm. All our patients
Lopes da Silva, F. H., Vos, J. E., Mooibroek, J., and Van Rotterdam,
showed cerebellar symptoms, in line with previous
A. 1980. Relative contributions of intracortical and thalamo-corti-
neuropathological findings of loss of Purkinje cells in
cal processes in the generation of alpha rhythms, revealed by
ULD (Haltia et al., 1969). As the Purkinje cells have
partial coherence analysis. Electroenceph. Clin. Neurophysiol. 50:
mainly inhibitory influence on the cerebellar deep nu-
clei, their loss could lead to enhanced cerebello–
Matsumura, M., Sawaguchi, T., Oishi, T., Ueki, K., and Kubota, K.
1991. Behavioral deficits induced by local injection of bicuculline
thalamo– cortical output, which may affect the oscilla-
and muscimol into the primate motor and premotor cortex. J. Neu-rophysiol. 65: 1542–1553.
Matsumura, M., Sawaguchi, T., and Kubota, K. 1992. GABAergic
Schnitzler, A., Salenius, S., Salmelin, R., Jousma¨ki, V., and Hari, R.
inhibition of neuronal activity in the primate motor and premo-
1997. Involvement of primary motor cortex in motor imagery: A
tor cortex during voluntary movement. J. Neurophysiol. 68:
neuromagnetic study. Neuroimage 6: 201–208.
Shibasaki, H., and Kuroiwa, Y. 1975. Electroencephalographic cor-
Salenius, S., Schnitzler, A., Salmelin, R., Jousma¨ki, V., and Hari, R.
relates of myoclonus. Electroenceph. Clin. Neurophysiol. 39: 455–
1997. Modulation of human cortical rolandic rhythms during nat-
ural sensorimotor tasks. Neuroimage 5: 221–228.
Tallon-Baudry, C., Bertrand, O., Delpuech, C., and Pernier, J. 1996.
Salmelin, R., and Hari, R. 1994. Spatiotemporal characteristics of
Stimulus specificity of phase-locked and non-phase-locked 40 Hz
sensorimotor MEG rhythms related to thumb movement. Neuro-
visual responses in human. J. Neurosci. 16: 4240 – 4249. sci. 60: 537–550.
Valzania, F., Strafella, A. P., Tropeani, A., Rubboli, G., Nassetti,
Salmelin, R., Ha¨ma¨la¨inen, M., Kajola, M., and Hari, R. 1995. Func-
S. A., and Tassinari, C. A. 1999. Facilitation of rhythmic events in
tional segregation of movement-related rhythmic activity in the
progressive myoclonus epilepsy: A transcranial magnetic stimula-
human brain. Neuroimage 2: 237–243.
tion study. Clin. Neurophysiol. 110: 152–157.
IN THE COURT OF APPEALS OF THE STATE OF KANSAS When the sufficiency of the evidence is challenged in a criminal case, the standard of review is whether, after review of all the evidence, taken in the light most favorable to the State, the appellate court is convinced that a rational factfinder could have found the defendant guilty beyond a reasonable doubt. In making this determination, an app
JASON WINN WORK EXPERIENCE Software Engineer Intern, Zynga, Toronto, May 2013 - August 2013 • Acted as the sole developer in creating C# framework bindings to connect Unity through C to C++ (script-generated bindings), and finally to native • Worked with Google’s IABv3, Amazon IAP, and a slew of other payment providers, in order to unify IAP into a convenient API for game te

 NeuroImage 12, 707–712 (2000)
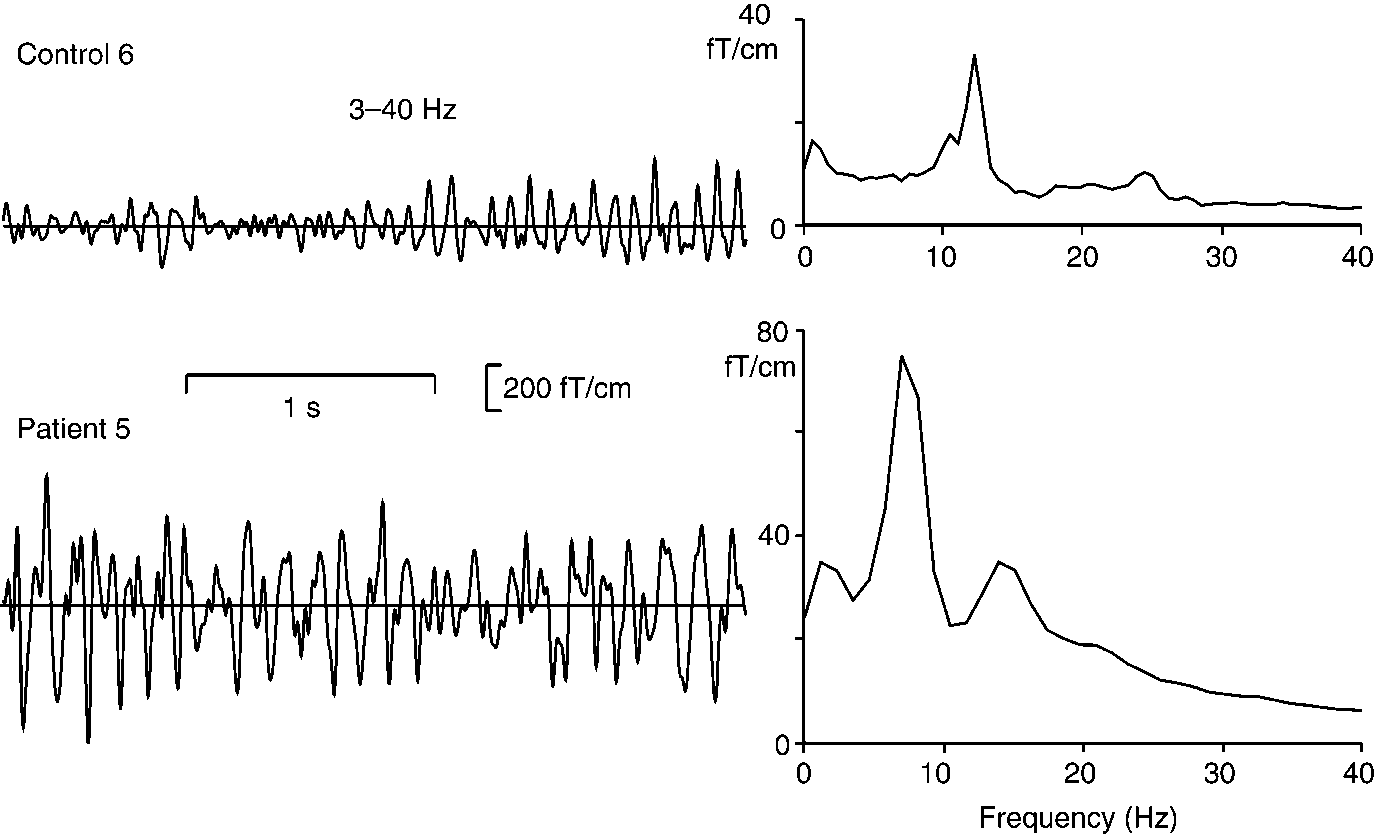
 MOTOR CORTEX RHYTHM IN MYOCLONUS EPILEPSY
Left: 3-s periods of spontaneous activity from one MEG channel over the left sensorimotor cortex in Control 6 and Patient 5 during
rest. Signals were filtered through 3– 40 Hz. Right: MEG spectra of 2-min epochs from the corresponding channels (not filtered).
MOTOR CORTEX RHYTHM IN MYOCLONUS EPILEPSY
Left: 3-s periods of spontaneous activity from one MEG channel over the left sensorimotor cortex in Control 6 and Patient 5 during
rest. Signals were filtered through 3– 40 Hz. Right: MEG spectra of 2-min epochs from the corresponding channels (not filtered).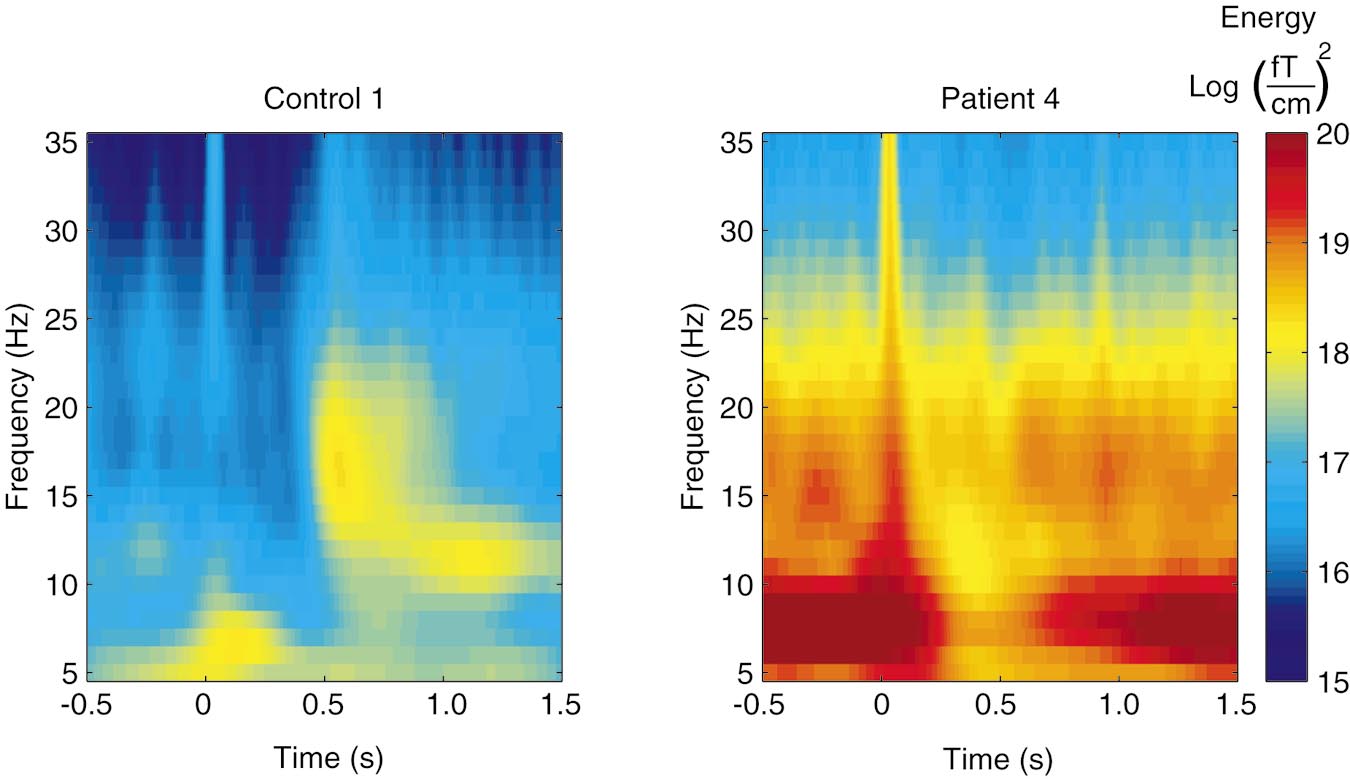
 Time-frequency representation of the energy at 5–35 Hz from 500 ms before to 1500 ms after LMN stimulation of Control 1 and
Patient 4. Note the logarithmic scale of the energy.
Time-frequency representation of the energy at 5–35 Hz from 500 ms before to 1500 ms after LMN stimulation of Control 1 and
Patient 4. Note the logarithmic scale of the energy.